RSS Explained: The Complete Beginner's Guide
What you will learn in this article:
- What a residual is and how the Residual Sum of Squares (RSS) is built from residuals.
- Why RSS is the foundational error quantity that underpins regression model training.
- How the Ordinary Least Squares principle uses RSS to find the best-fit line.
- The key limitations of RSS and why practitioners usually report MSE, RMSE, or R² instead.
- How RSS connects to every other common regression metric in a single coherent framework.
Introduction
Before a model can be evaluated, it needs to be trained. And training a regression model means answering one fundamental question: out of all the possible lines or curves we could draw through the data, which one fits best?
The answer in almost all classical regression is: the one that minimizes the total prediction error. The Residual Sum of Squares (RSS) is the way that total error is measured during training. It is the quantity that regression algorithms minimize when they search for the best-fit line, and it is the building block from which all other common regression metrics, RMSE, MSE, and R², are derived.
Understanding RSS is therefore not just an academic exercise. It is the key to understanding why a regression line sits where it does, why some metrics are sensitive to outliers, and how all the pieces of regression evaluation fit together.
Problem Statement
Imagine you have a scatter of data points and you want to draw the single straight line that best represents the relationship. If you drew the line by eye, two people would draw two different lines, and there would be no principled way to decide which is correct. What you need is a mathematical score that tells you, for any proposed line, exactly how well it fits the data. A lower score means a better fit. Finding the line with the lowest possible score is the optimization problem that training a linear regression model solves.
That score is RSS. By defining fit quality precisely through a single number, RSS gives the training algorithm something concrete to minimize, and gives the theorist something clean to analyze.
Core Concepts and Terminology
| Term | Plain-language meaning |
|---|---|
| Residual | The gap between what actually happened and what the model predicted for a specific data point. Positive when the model under-predicted, negative when it over-predicted. |
| Squared residual | The residual multiplied by itself. Always positive, and larger residuals produce disproportionately large squared values. |
| RSS | The sum of all squared residuals across every data point. A lower RSS means the model fits the data better. |
| OLS (Ordinary Least Squares) | The standard method of fitting a linear regression model by finding the parameters that minimize RSS. |
| MSE | RSS divided by the number of data points. Normalizes RSS so it does not grow just because the dataset is larger. |
| RMSE | The square root of MSE. Converts the metric back to the original units of the target variable. |
How It Works
Every prediction a model makes comes with a gap between the prediction and reality. If a model predicts a house price of $280,000 and the house actually sold for $300,000, the residual for that observation is $20,000. The model was $20,000 too low. If another house sold for $250,000 but the model predicted $270,000, the residual is negative $20,000. The model was $20,000 too high.
If you simply added up all these residuals, the positive and negative values would cancel each other out. A model that is exactly $20,000 too high on one house and exactly $20,000 too low on another would appear to have a total error of zero, which is completely misleading. Both predictions were wrong, and that wrongness should be reflected in the score.
The fix is to square each residual before adding them up. Squaring removes the sign: a residual of negative $20,000 becomes positive $400,000,000 after squaring, the same as a positive $20,000 residual. Over- and under-predictions both add to the total. Squaring also has a second important effect: larger residuals are penalized far more than smaller ones. A residual of $20,000 contributes four times as much to RSS as a residual of $10,000, not just twice as much. This makes RSS, and all the metrics built from it, sensitive to large errors.
RSS is the sum of all these squared residuals. The lower it is, the better the model's predictions fit the data.

Practical Example
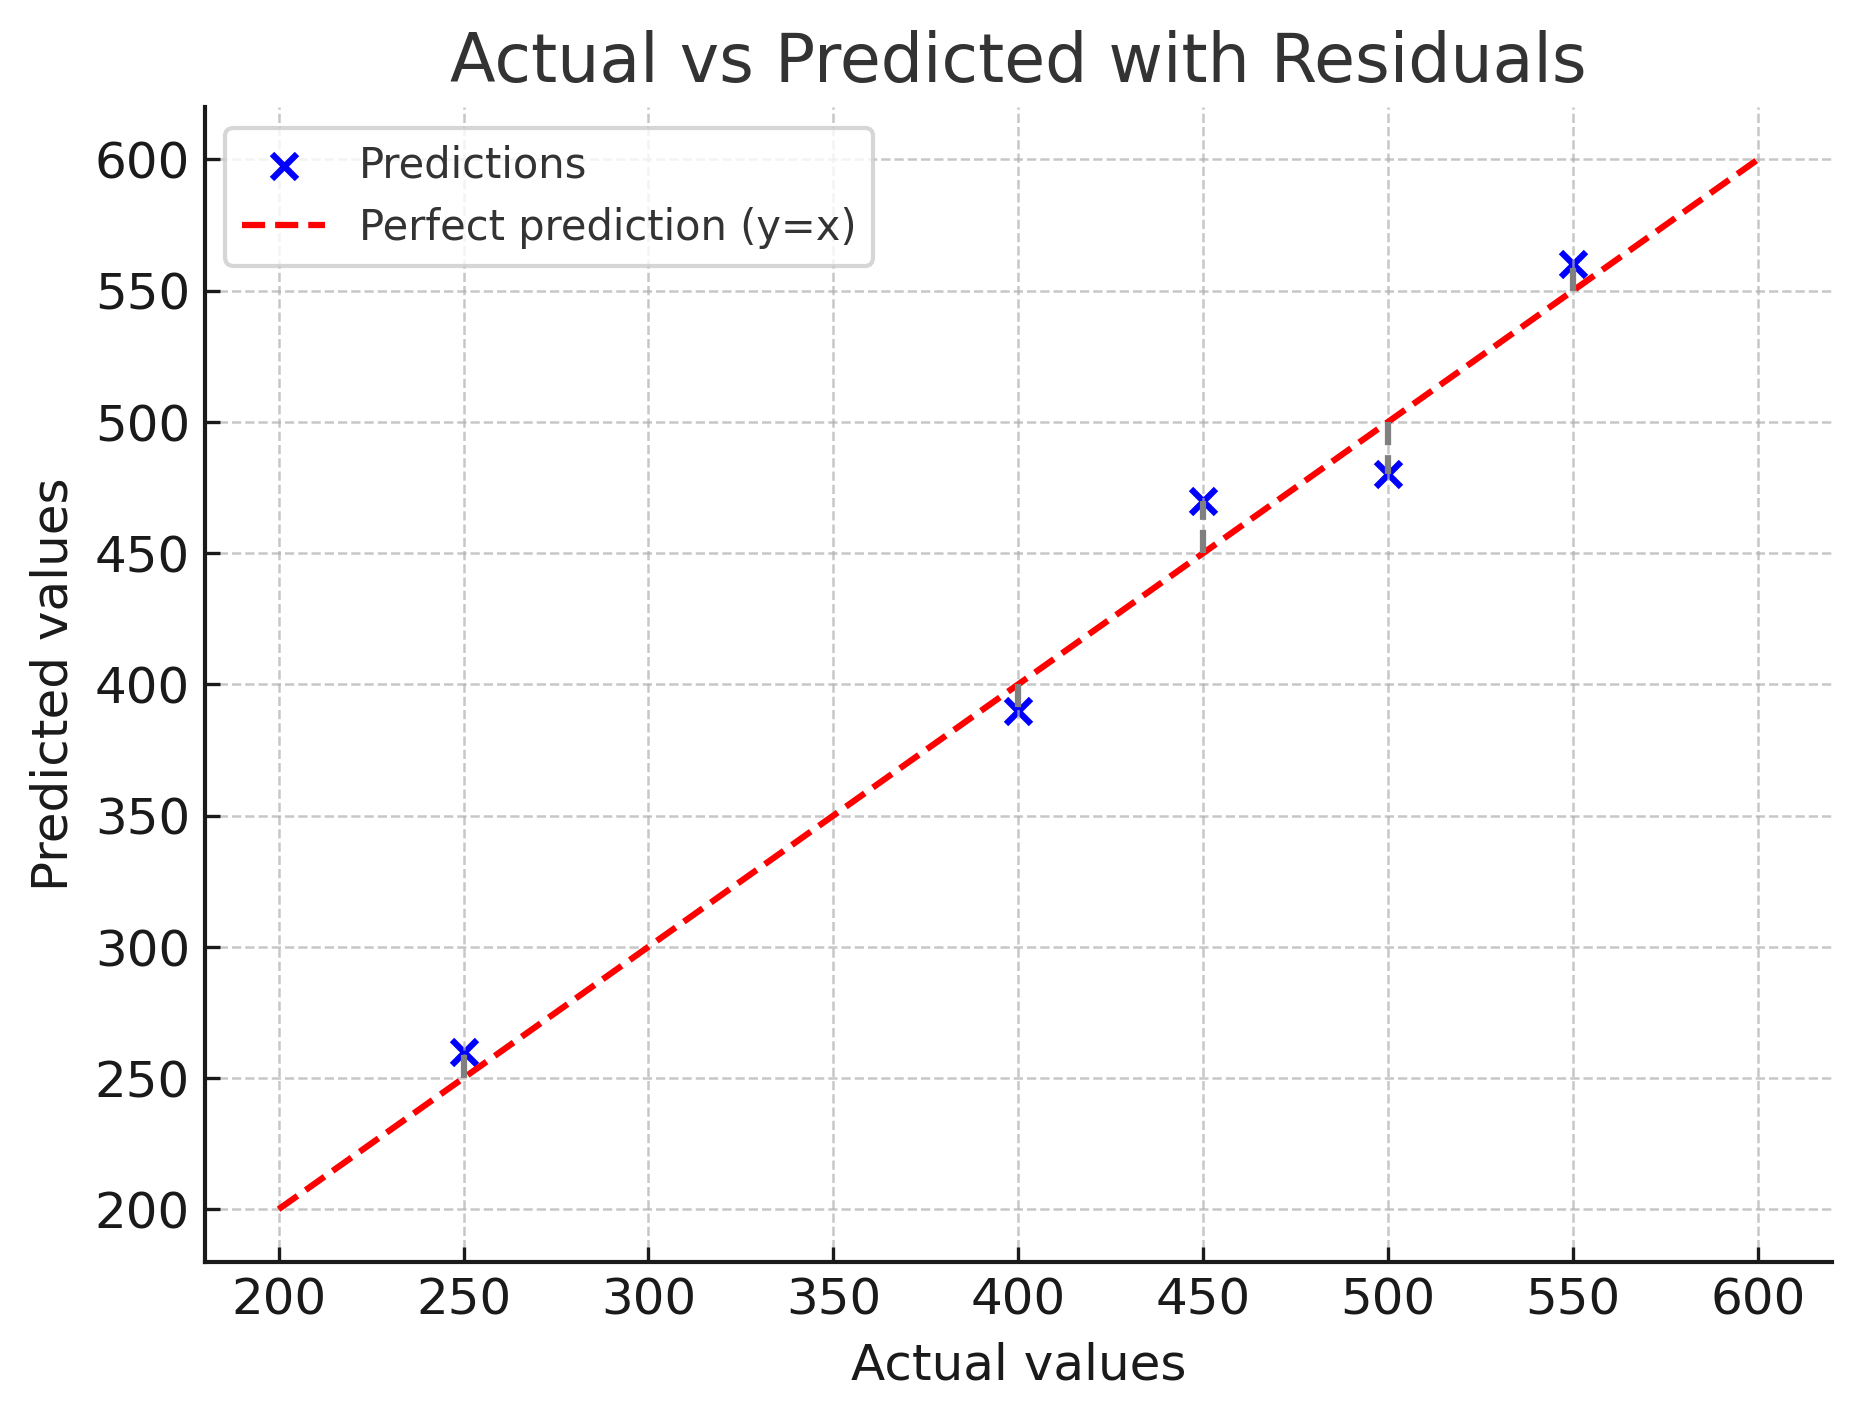
Consider a model predicting prices for five houses. The actual and predicted prices (in thousands of dollars) are listed below, along with the residual and squared residual for each house.
| House | Actual Price | Predicted Price | Residual | Squared Residual |
|---|---|---|---|---|
| 1 | 250 | 260 | −10 | 100 |
| 2 | 400 | 390 | +10 | 100 |
| 3 | 450 | 470 | −20 | 400 |
| 4 | 500 | 480 | +20 | 400 |
| 5 | 550 | 560 | −10 | 100 |
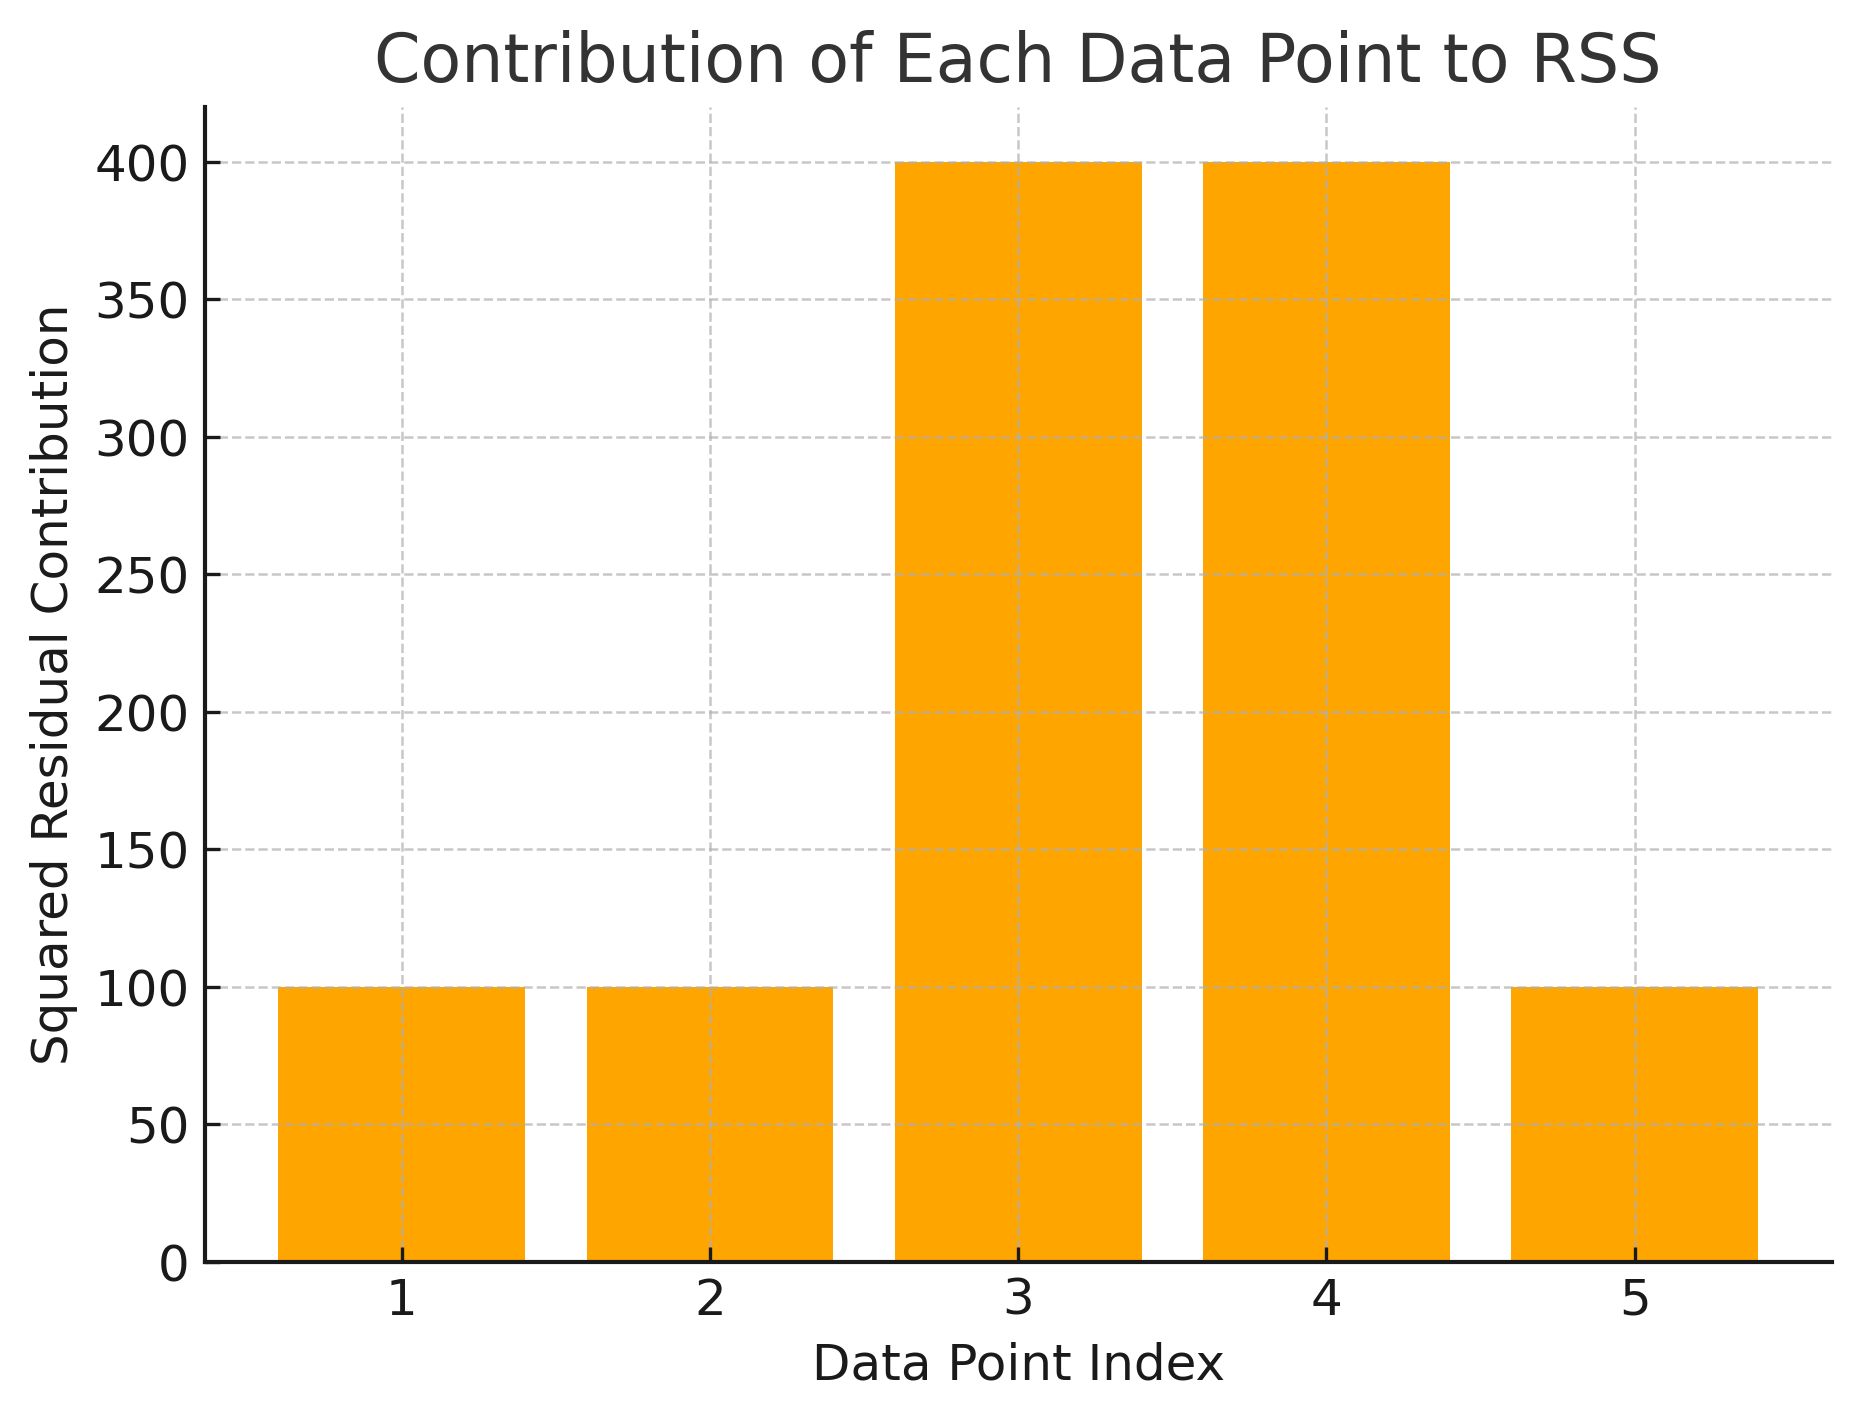
Summing the squared residuals: 100 plus 100 plus 400 plus 400 plus 100 equals 1,100. That is the RSS for this model on this dataset. A perfect model would have RSS = 0. The further RSS is from zero, the worse the model fits the data.
Notice that Houses 3 and 4, each with a $20,000 error, contribute 400 each to RSS, while the other three houses with $10,000 errors contribute only 100 each. Houses 3 and 4 account for 800 of the total 1,100, even though they represent only two out of five observations. This concentration of RSS in the largest errors is a direct consequence of squaring.
The Least Squares Principle: Why RSS Is Central to Model Training
When you train a linear regression model, the algorithm does not pick a line arbitrarily. It searches through all possible combinations of slope and intercept to find the one that produces the lowest RSS. This approach is called Ordinary Least Squares (OLS) and it is the standard fitting procedure for linear regression.
The intuition is like adjusting a ruler over a scatter of data points. You can tilt it, shift it up or down, and slide it left or right. RSS is the score for any given position: the lower the score, the better the ruler fits the data. OLS finds the single position that minimizes that score exactly.
This is why RSS is so foundational. It is not just a way to evaluate a finished model. It is the objective function that defines what "best-fit" means in the first place. Every other evaluation metric, MSE, RMSE, R², is built on top of RSS, or defined in relation to it.
Advantages
- Direct connection to model training. RSS is the quantity that OLS minimizes, so understanding it connects model evaluation directly to model fitting. When you reduce RSS, you are doing what the algorithm was trained to do.
- Foundation for all other regression metrics. MSE, RMSE, and R² all derive from RSS. Once you understand RSS, understanding those metrics becomes much simpler.
- Mathematically tractable. Because RSS is the sum of squared functions, it is differentiable and has convenient mathematical properties that make it possible to find the minimum analytically. This is why OLS has a clean closed-form solution, something that metrics based on absolute errors do not always provide.
Limitations and Trade-offs
- Scale-dependent and not comparable across datasets. RSS grows as the dataset grows. A model evaluated on 10,000 observations will almost always have a higher RSS than the same model evaluated on 100 observations, even if it fits equally well proportionally. This makes raw RSS useless for comparing model quality across datasets of different sizes. Dividing by the number of observations (to get MSE) solves this problem.
- No natural upper or lower bound beyond zero. Unlike R², which ranges from below zero to one, RSS can be any non-negative number. Without knowing the scale of the data and the size of the dataset, an RSS value communicates very little on its own.
- Sensitive to outliers. Because errors are squared, a single data point with a very large residual can dramatically inflate RSS. Whether this is a limitation or a feature depends on the application: in some cases you want to be sensitive to large errors; in others you want robustness.
Common Mistakes
- Reporting RSS directly in model evaluation. RSS is most useful internally during training and for understanding relationships between metrics. For reporting model performance to others, RMSE or R² are almost always more appropriate because they are normalized and directly interpretable.
- Comparing RSS across models trained on different datasets. RSS is affected by dataset size and target scale, so comparing raw RSS values across different problems is meaningless. Always use normalized metrics for cross-dataset comparisons.
- Using RSS to compare models with different numbers of features. Adding features to a model will generally reduce its RSS on the training data, but this does not mean the model is genuinely better. A model with too many features may be overfit. Use test-set evaluation and information criteria for model comparison.
Best Practices
- Think of RSS as the engine of regression model training, not the dashboard. Use it to understand how training works, but report RMSE or R² to communicate results.
- When you want to understand why RMSE is sensitive to outliers, remember it is built on RSS. Squaring enters the pipeline at the very first step.
- When comparing two nested models (one with fewer features than the other), a lower RSS on the same dataset indicates better fit, but only if evaluated on held-out data, not the training data.
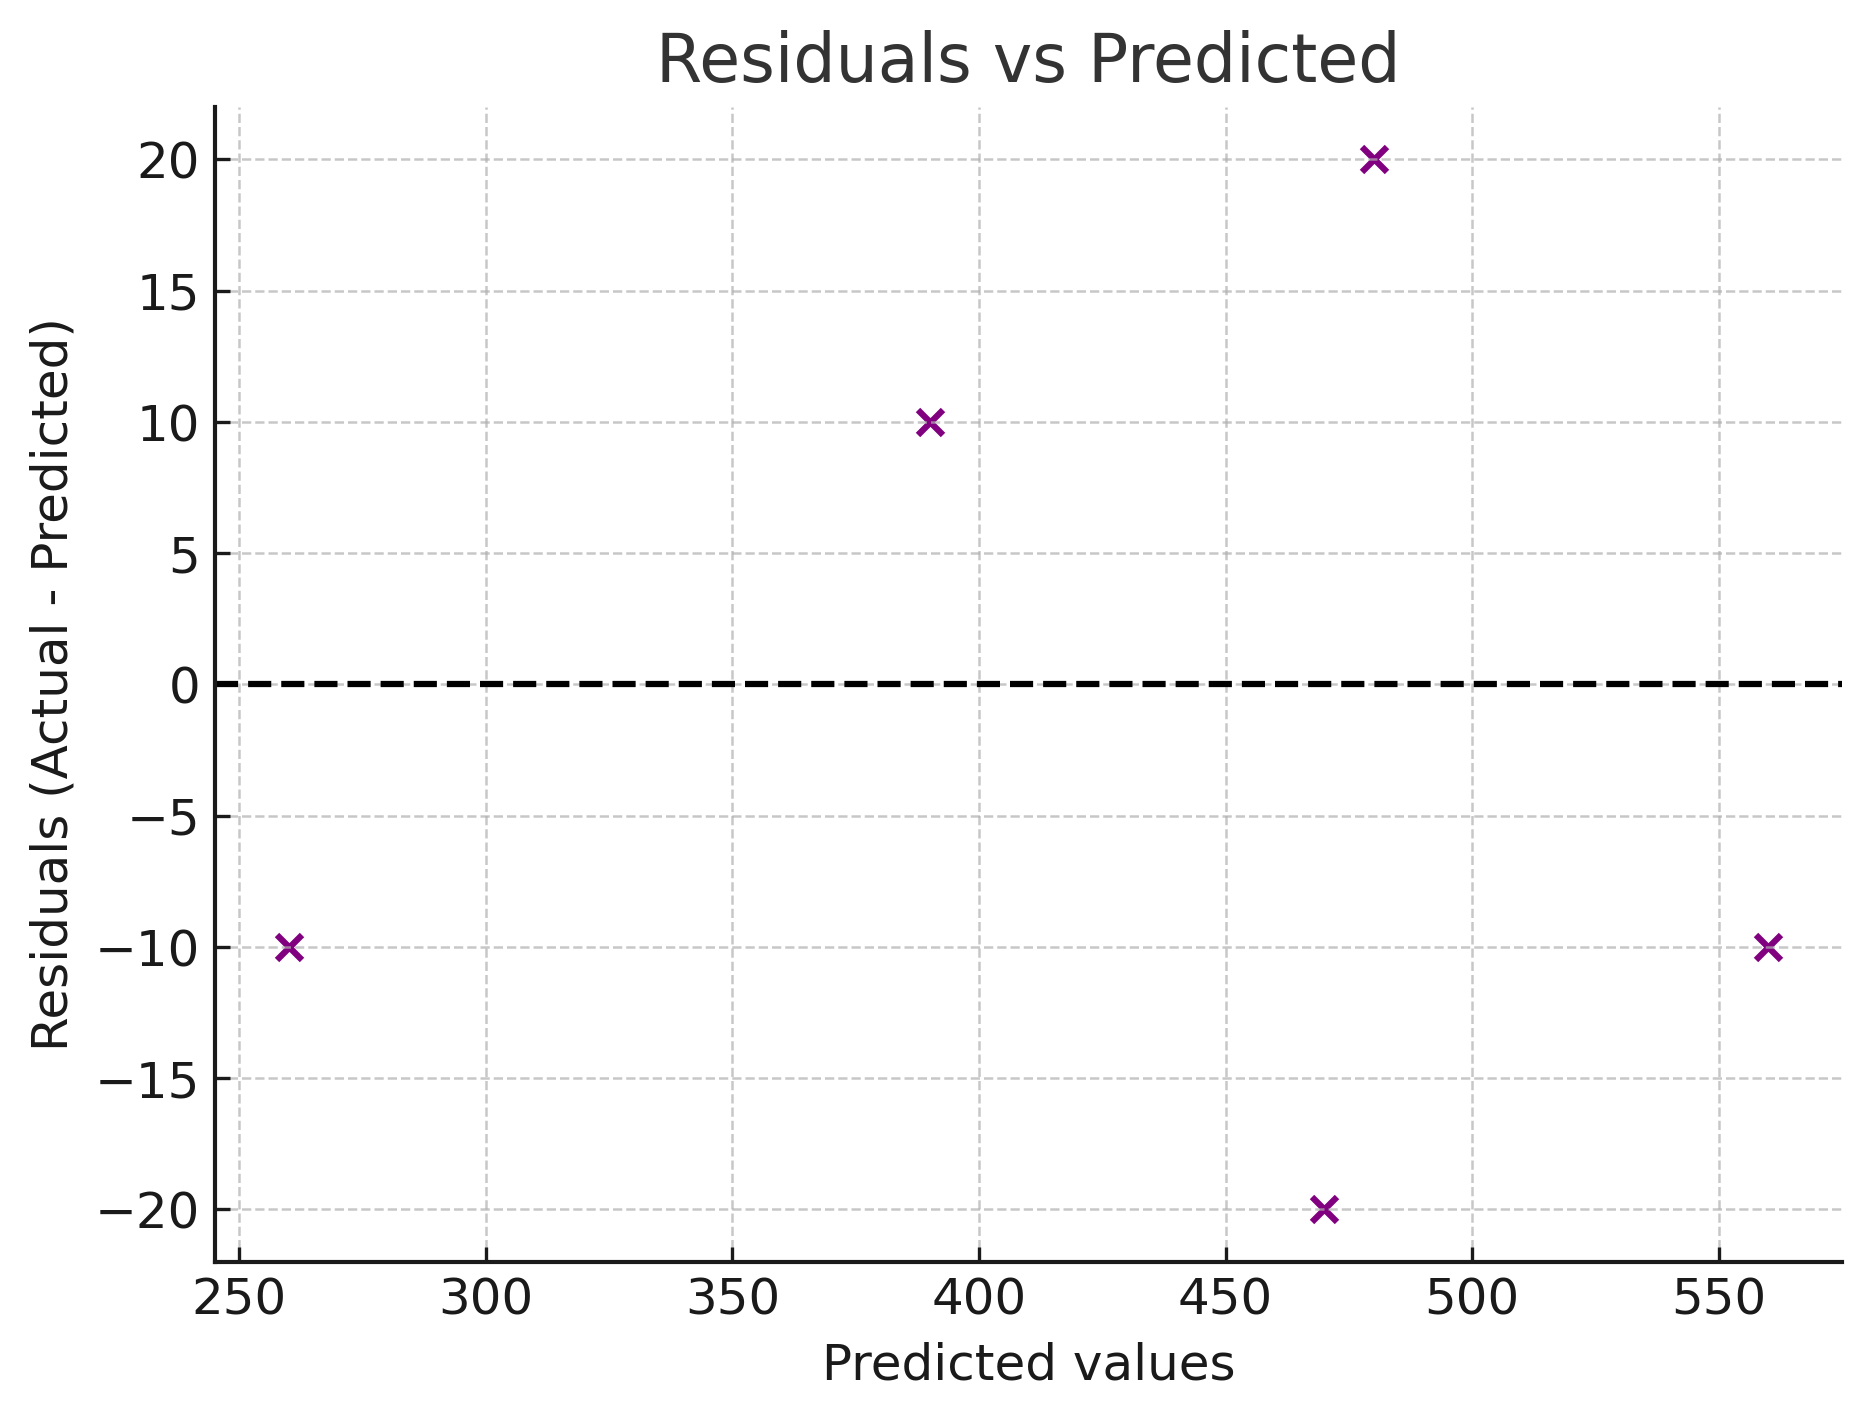
- Always examine a residual plot alongside any RSS-derived metric. The distribution of individual residuals tells a story that no single summary statistic can capture on its own.
Comparison with Related Metrics
| Metric | How it relates to RSS | Units | Primary use |
|---|---|---|---|
| RSS | The base quantity: sum of all squared residuals | Squared target units | Model training objective; theoretical analysis |
| MSE | RSS divided by the number of observations | Squared target units | Normalized error for dataset-size comparison |
| RMSE | Square root of MSE (square root of RSS/n) | Same as target | Interpretable error magnitude in real units |
| R² | 1 minus (RSS divided by SST), the total variance | Unitless (0 to 1) | Scale-free measure of variance explained |
FAQ
What does RSS = 0 mean?
It means every single prediction was exactly equal to the actual value. The model was perfect on this dataset. In practice, RSS = 0 essentially never happens on real data, and if it does on a training set, it usually signals severe overfitting rather than a genuinely perfect model.
Is a smaller RSS always better?
On the same dataset with the same number of observations, yes. But across different datasets, a smaller RSS does not necessarily mean a better model, because RSS scales with dataset size and target magnitude. Always normalize by converting to MSE or RMSE before making comparisons across datasets.
Why does OLS minimize RSS and not MAE?
OLS minimizes RSS because the squared error function is smooth and differentiable, which means calculus can be applied to find the exact minimum analytically. MAE uses absolute values, which are not differentiable at zero, making the optimization mathematically harder. More recently, numerical methods have made MAE-based fitting practical, but OLS on RSS remains the classical standard.
What is the difference between RSS and SST?
RSS is the sum of squared residuals, the squared gaps between predictions and actual values. SST (Total Sum of Squares) is the sum of squared deviations from the mean of the target, the total variation in the actual values. R² is computed as one minus the ratio of RSS to SST, expressing what fraction of the total variation the model explains.
When should I report RSS versus RMSE?
Report RSS when discussing model internals, such as the fitting procedure or nested model comparisons on a fixed dataset. Report RMSE when communicating model performance to anyone else. RMSE is in the original units of the target variable and is normalized by dataset size, making it far more interpretable and comparable.
References
- Wikipedia: Residual Sum of Squares
- James, G., Witten, D., Hastie, T., & Tibshirani, R. (2021). An Introduction to Statistical Learning (2nd ed.). Springer.
- Montgomery, D.C., Peck, E.A., & Vining, G.G. (2021). Introduction to Linear Regression Analysis (6th ed.). Wiley.
- Scikit-learn: Model Evaluation
Key Takeaways
- RSS is the sum of all squared residuals: it quantifies the total prediction error of a model on a dataset.
- Squaring residuals eliminates sign cancellation and penalizes large errors disproportionately, two deliberate design choices that ripple through every metric built on RSS.
- RSS is the objective that Ordinary Least Squares minimizes during model training: the best-fit line is defined as the one with the lowest RSS.
- RSS is scale-dependent and grows with dataset size, making it unsuitable for direct comparison across different datasets. Use MSE or RMSE instead.
- MSE, RMSE, and R² all derive from RSS. Understanding RSS unlocks a coherent understanding of all three.
- RSS belongs in your understanding of how models are built; RMSE and R² belong in your reports of how well they perform.
Related Articles